Investigation the Effect of Dust on Traffic and Speed of All Kinds of Vehicles (Case Study: Khuzestan Province)
Saied Hesami1 * , Mohsen Najafi Alamdarloo2 and Asghar Molamohamadi Omran3
http://dx.doi.org/10.12944/CWE.10.Special-Issue1.60
Atmospheric conditions are one of the effective factors on transport and its safety. One of the undesirable weather phenomena that have effect on various aspects of human life is dust. The western provinces, particularly Khuzestan has faced with dust phenomenon in recent years. In this study, using the information in relation to dust and traffic and using a statistical analysis how the impact of changes of dust on the traffic intensity and the average speed of vehicles in the axes of the province have been studied. And this effect was displayed as quantitative relationship.
Copy the following to cite this article:
Hesami S, Alamdarloo M. N, Omran A. M. Investigation the Effect of Dust on Traffic and Speed of All Kinds of Vehicles (Case Study: Khuzestan Province). Special Issue of Curr World Environ 2015;10(Special Issue May 2015). DOI:http://dx.doi.org/10.12944/CWE.10.Special-Issue1.60
Copy the following to cite this URL:
Hesami S, Alamdarloo M. N, Omran A. M. Investigation the Effect of Dust on Traffic and Speed of All Kinds of Vehicles (Case Study: Khuzestan Province). Special Issue of Curr World Environ 2015;10(Special Issue May 2015). Available from: http://www.cwejournal.org?p=645/
Download article (pdf)
Citation Manager
Publish History
Introduction
Dust phenomenon has long been with human society, and certainly human should see this on their side in the future and accept that as with many natural phenomena cannot control it completely. But the important point is that the problems that it creates today with its negative impact have fundamental differences. And of course it is clear that amount and how negative impacts of human activities are quite different from the past. To date several studies on the phenomenon of dust in inside and outside of the country have been carried out. Of these studies can point out of Romanov’s studies. He investigated dust storms in Central Asia and Kazakhstan and showed that most of these storms occur during the warm weather (Romanov ., 1961). Orlovsky was studied temporal and spatial distribution of dust and sand storms in Turkestan during years (1960-1936) for the 40 stations (Orlovsky .,1962). Youlin in the study of dust storm that occurred in 1993 in North of China and Tarim Basin was estimated numbers of dead are 85 people and amount of destroyed crops are 373,000 hectares (Youlin ., 2002). Squires in a study shows that soil erosion by wind at least 161 million tons of soil moves in the Canada that its worth is about $ 249 million(Squires .,2002). Sonia by investigating the changes in trace elements in dust in Africa declares that changes in trace elements of dust are often determined by bedrock, weathering and transportation and also features of elements of their distribution have high impact(Sonia .,2008). Azim Zadeh and colleagues were declared large dust storms occur when a prolonged drought occurred, soil surface is dry and the wind blow with considerable speed (Azim Zadeh., 2002). Kaviani, knows the reason of formation of dust in desert is caused by instability air and he believes that atmosphere above the surface of deserts is very unstable, and have conditions of development of instability phenomena like small vortex of dust (Kaviani ,2007). Reispoor in his graduate thesis named statistical analysis and synoptic of dust phenomenon in Khuzestan was investigated the statistical analysis of the days and months of the phenomenon happen and determination of the origin using climate parameters (Reispoor ., 2008). In relation to the impact of weather on safety of transportation numerous domestic and foreign researches were conducted, but so far, the impact of dust on transportation not investigated and in this study is the first time to discuss this important matter.
Khuzestan province is located in southwestern of Iran near Persian Gulf and Arvand River. It is tenth of the country in size and is second in gross domestic product and ranked first in the country in power generation which accounted for 70% of the country's oil exports and an annual production of over 10 million tons of petrochemicals, Khuzestan has become one of the most important province of Iran in economy. Also, due to geographical location and existence many industries and mines have much more active transportation than most provinces of the country. Table 1 shows transportation cargo and passengers in Khuzestan province from years of 2006 to 2009. According to Table 1, it is clear Khuzestan province in terms of displacement of cargo is the second and in the transportation of passengers is the fifth. Therefore evaluate the factors affecting the transportation of the province is looks essential. Traffic volume and traffic speed are two very important parameters affecting the planning of traffic and road safety, accordingly, in this study the amount and how impact of dust on these factors are discussed
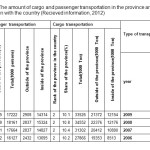 |
Table 1: The amount of cargo and passenger transportation in the province and in comparison with the country (Recieved information, 2012) Click here to View table |
Methodology
At the first from General Meteorological Organization of the province Information related to dust and its severity on a daily basis from 1385 to 1388 for all weather stations were received. From this information, the presence or absence of dust and the intensity in each day could be derived. Normally, the horizontal visibility is 10,000 meters. According to the agreement of meteorological when the horizontal visibility is less than 10,000 meters due to dust phenomenon, it is dusty day. Reducing the horizontal visibility the severity of dust become rises. To express amount of intensity of dust can use of the number of horizontal visibility in the dust day to normal day (10,000 meters). For example, if the horizontal visibility in dusty day equal to 5000 meters, this number is equal to 0.5 which indicates that in the day sight distance is 0.5 time of the normal day. For convenience, in this study this number is called β. In other words, β number indicates the severity of dust and it is a number between zero and one. The number 1 indicates the absence of dust and zero indicates the maximum intensity of dust. In several axis of the province movement counters are installed that record vehicle type and its average speed automatically. Refer to the General Administration of terminals of Khuzestan the data recorded by this movement counters were received. Unfortunately, in some axis movement counters were disabled in long time and cannot appropriate use of their data. Therefore investigations was conducted with information related to the 5-axis with the origin of Ahvaz to (Abadan, Susangerd, Kupal three way, Mollasani and Andimesh) and 2 axis with origin of Abadan to (Ahvaz and Imam Khomeyni Horber) is fairly complete and in this study, data of these seven-axis is used. Table 2 shows the situation of dust in Ahvaz and Abadan in the studied years generally.
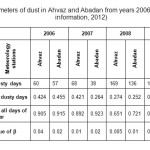 |
Table 2: Parameters of dust in Ahvaz and Abadan from years 2006 to 2009 (Recieved information, 2012) Click here to View table |
Statistical Analysis
In this section statistical analysis of our findings is discussed. The purpose of this section is to investigate the relationship between dust as independent variables and dependent variables (including daily traffic and average speed of the vehicles). Linear regression was used to investigate the relationship. Linear regression is a linear relationship between two variables X and Y as Y = bX + c. In this equation the c is called intercept the number is the predicted value of Y when X is zero, and b is the angle factor that indicates the amount of Y change per unit change in X. In all axes in any point of time (dusty days that their movement information was available from 2006 to 2009) that the information was existed the data is used. Therefore for statistical analysis of traffic at 7 selected axis (Ahvaz to Abadan, Ahwaz to Kupal three way, Ahvaz to Andimesh, Ahvaz to Mollasani, Ahvaz to Susangerd, Abadan to Ahwaz and Abadan to Imam Khomeyni Harbor) From 2006 to 2009, in 1871 dusty days movement information is available and this information was used for analysis. Traffic information such as movement and average daily speed for the 5 types of traffics (Cars and vans, light trucks and minibus, two axes and three axes trucks, buses and trucks with more than three axes) are available. So in this part independent variable β number and dependent variables daily average speed and daily movement are of this five traffic groups. For 5-axis with origin of Ahvaz and for the axis to the origin of the Abadan β number of Ahvaz and Abadan is used respectively. Then by transfer of this information to SPSS software and use linear regression to examine the relationship between the independent variable (severity of dust) and dependent variables (daily average speed and daily movement of all mentioned vehicle types) are investigated. Table 3 shows the results of the software. As Table 3 shows the average speed of traffic in each of the 5 groups had significant correlation with the number β and given that sign of b is positive for all of them indicate that by increasing β number (reduce the severity of dust) the average speed is increased for all groups. Only the daily movement of cars and vans have meaningful relationship with dust (sig less than 0.5) and due to negative sign of b with reduced β number (increased severity of dust), the number of daily movement of cars and vans increases.
Table 3: Statistical analysis of movement parameters for selected axis of the province with independent variable (Recieved information, 2012)
| Dependent variable | c | b | r | sig | Sample volume | |
| Average Speed(km/h) of car and van | 83 | 3 | 0.185 | 0.034 | 0.0 | 1871 |
| Daily movement of car and van | 5914.3 | -710 | 0.143 | 0.02 | 0.046 | 1871 |
| Average speed (km/h) of two axel light truck and minibus | 65.2 | 1.8 | 0.142 | 0.02 | 0.047 | 1871 |
| Daily Movement of two axel light trucks and minibus | 526 | -27 | 0.02 | 0.0004 | 0.379 | 1871 |
| Average speed (km/h) of two and three axel trucks | 63.86 | 2.9 | 0.158 | 0.024 | 0.012 | 1871 |
| Daily Movement of two and three axel truck | 389.6 | 5.54 | 0.004 | 0.0 | 0.88 | 1871 |
| Average speed (km/h) of Bus | 68.8 | 3.9 | 0.178 | 0.031 | 0.001 | 1871 |
| Daily Movement of Bus | 474.8 | -26 | 0.019 | 0.0003 | 0.417 | 1871 |
| Average speed (km/h) of truck with more than three axel | 64.3 | 3.6 | 0.168 | 0.028 | 0.003 | 1871 |
| Daily Movement of truck with more than three axel | 384.5 | -12 | 0.001 | 0.0 | 0.780 | 1871 |
Results and Discussions
Between intensity of dust and movement of cars and vans in the selected axis of Khuzestan province exists linear relationship. According to this relationship (Daily movement of car and van=5914.3-710 β) can be seen that with increasing dust movement of this traffic group in the axes of the province increases. This increasing could be due to the closing the province during severe dusty days and also increase desire of citizens to leave the city, Therefore is suggested with cultural programs and appropriate measures, the conditions created that the citizens on a dusty days, except in case of emergency, not out of their homes.There is a significant relationship between intensity of dust and speed of all kind of vehicles and with increasing intensity of dust vehicle speed decreases. According to Table 3, it is clear that the intensity of dust has the greatest impact on speed of two and three-axle trucks and buses (The biggest angle factor with respect to the y-intercept). In other words, increasing the intensity of dust, speed of this vehicle affected more from other vehicles and it will be decreased.
According to Table 3 it increasing the intensity of dust has relatively low impact on the average speed of cars and vans. Considering to the high speed of this group of vehicle relative to the other vehicles, in the event of dust and reducing the visibility are most vulnerable groups of vehicles. Therefore is recommended that in dusty days police have more control on the speed of these vehicles. In this regard, it is suggested in the case of dust due to its intensity, speed limits and the way the drivers are considered to be announced (Using mass media such as radio or the use of electronic traffic signs).
Acknowledgements
Great thanks to Dr Nahid Najafi Alamdarloo and Dr mahshid Najafi Alamdarloo
References
- Azim Zadeh, A. Study the effect of physical and chemical properties of soil in the soil erodibility index and provide a model for its prediction. Journal of Gorgan University of Agricultural Sciences and Natural Resources. (2002).
- Kaviani, M.R. Micro Climatology (Saamt, 2007).
- Orlovsky, L. Dust storm in Turkmenistan. Jornal of Arid Environments, 42 (1962).
- Recieved information by the author from General Terminals Administration of Khuzestan& General Meteorological Organization of Khuzestan& Road transportation and Maintenance Organization of Khuzestan (2012).
- Reispoor, K. Statistical analysis and Synoptic of dust phenomenon in Khuzestan. MS Thesis University of Sistan and Baluchestan (2008).
- Romanof, B. Dust storms in Gobian Zone of Mongolia. The First PRC–Mongolia Workshope on climate change in arid and semi–arid Region over the Central Asia, 21(1961).
- Sonia, C. trace element variation in size-fractioned african desert dust. journal of arid environment, 1034-1045 (2008).
- Squires, V. Dust and sand storms : An early warning of impending disaster. Global Alarm: Dust and sand storm from the world' s drylands, 16(2002).
- Youlin, Y. Black windstorm in northwest Chin: A case study of the strong sand – dust storms on May 5th 1993. Global Alarm: Dust and sand storm from the world ' s drylands, 29(2003).


